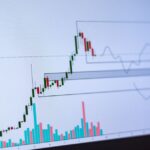

Bitcoin candlestick charts provide a simple yet effective way to understand market trends and sentiment, making them a popular tool among Bitcoin traders. Originating in 18th-century Japan, these charts have become a staple of Western financial markets since the late 1980s. They visually represent price movements, offering a quick overview of highs, lows, opening, and closing prices within a specific timeframe. This allows traders to identify bullish (price increase) and bearish (price decrease) patterns.
Each candlestick displays four key price points: the opening price, closing price, highest price, and lowest price. A green body signifies a closing price higher than the opening price (bullish), while a red body indicates the opposite (bearish). The length of the body reflects buying or selling pressure, with longer bodies suggesting stronger conviction. Wicks (shadows) extending above or below the body represent the highest and lowest prices reached during the period.
Analyzing Bitcoin price charts using technical analysis is crucial for informed trading decisions. Platforms like TradingView offer easy-to-use tools, including candlestick, bar, and line charts, along with technical indicators like moving averages (MAs) and the relative strength index (RSI). Combining candlestick charts with these additional indicators provides a more comprehensive market analysis.
While candlesticks offer valuable insights into short-term price movements and market sentiment, they shouldn’t be the sole basis for trading decisions. Advanced charting techniques, such as Fibonacci retracement (identifying support and resistance levels), volume profile (analyzing trading volume at specific prices), and Elliott Wave Theory (predicting price movements based on market psychology), offer further analytical depth. Other indicators like the RSI (measuring price momentum) and SMAs/EMAs (showing average price over time) can enhance your understanding of market dynamics. Remember that charts don’t guarantee profits. Always combine technical analysis with sound risk management practices and never invest more than you can afford to lose. This information is for educational purposes only and does not constitute financial advice.