
![]() Akash Girimath
Akash Girimath
FXStreet
Bitcoin price has been in a steady consolidation for more than two weeks and shows no signs of directional bias. However, the Non-Farm Payrolls (NFP) announcement on October 7 could trigger a volatile episode for BTC that could resolve its range tightening and establish a directional bias.
Bitcoin price remains above $19,157, which is the highest traded volume level for 2022, aka Point of Control (POC). As mentioned in the previous article, buyers are safe as long as BTC remains above the POC; however, a breakdown could result in a steep correction to the next high-volume node at $15,551.
Beyond this support floor, there are two crucial levels at $13,575 and $11,989, where a macro bottom could occur for BTC. Not a lot has changed on this three-day chart for Bitcoin, but investors need to keep a close eye on the POC at $19,157 and the immediate support level at $15,551.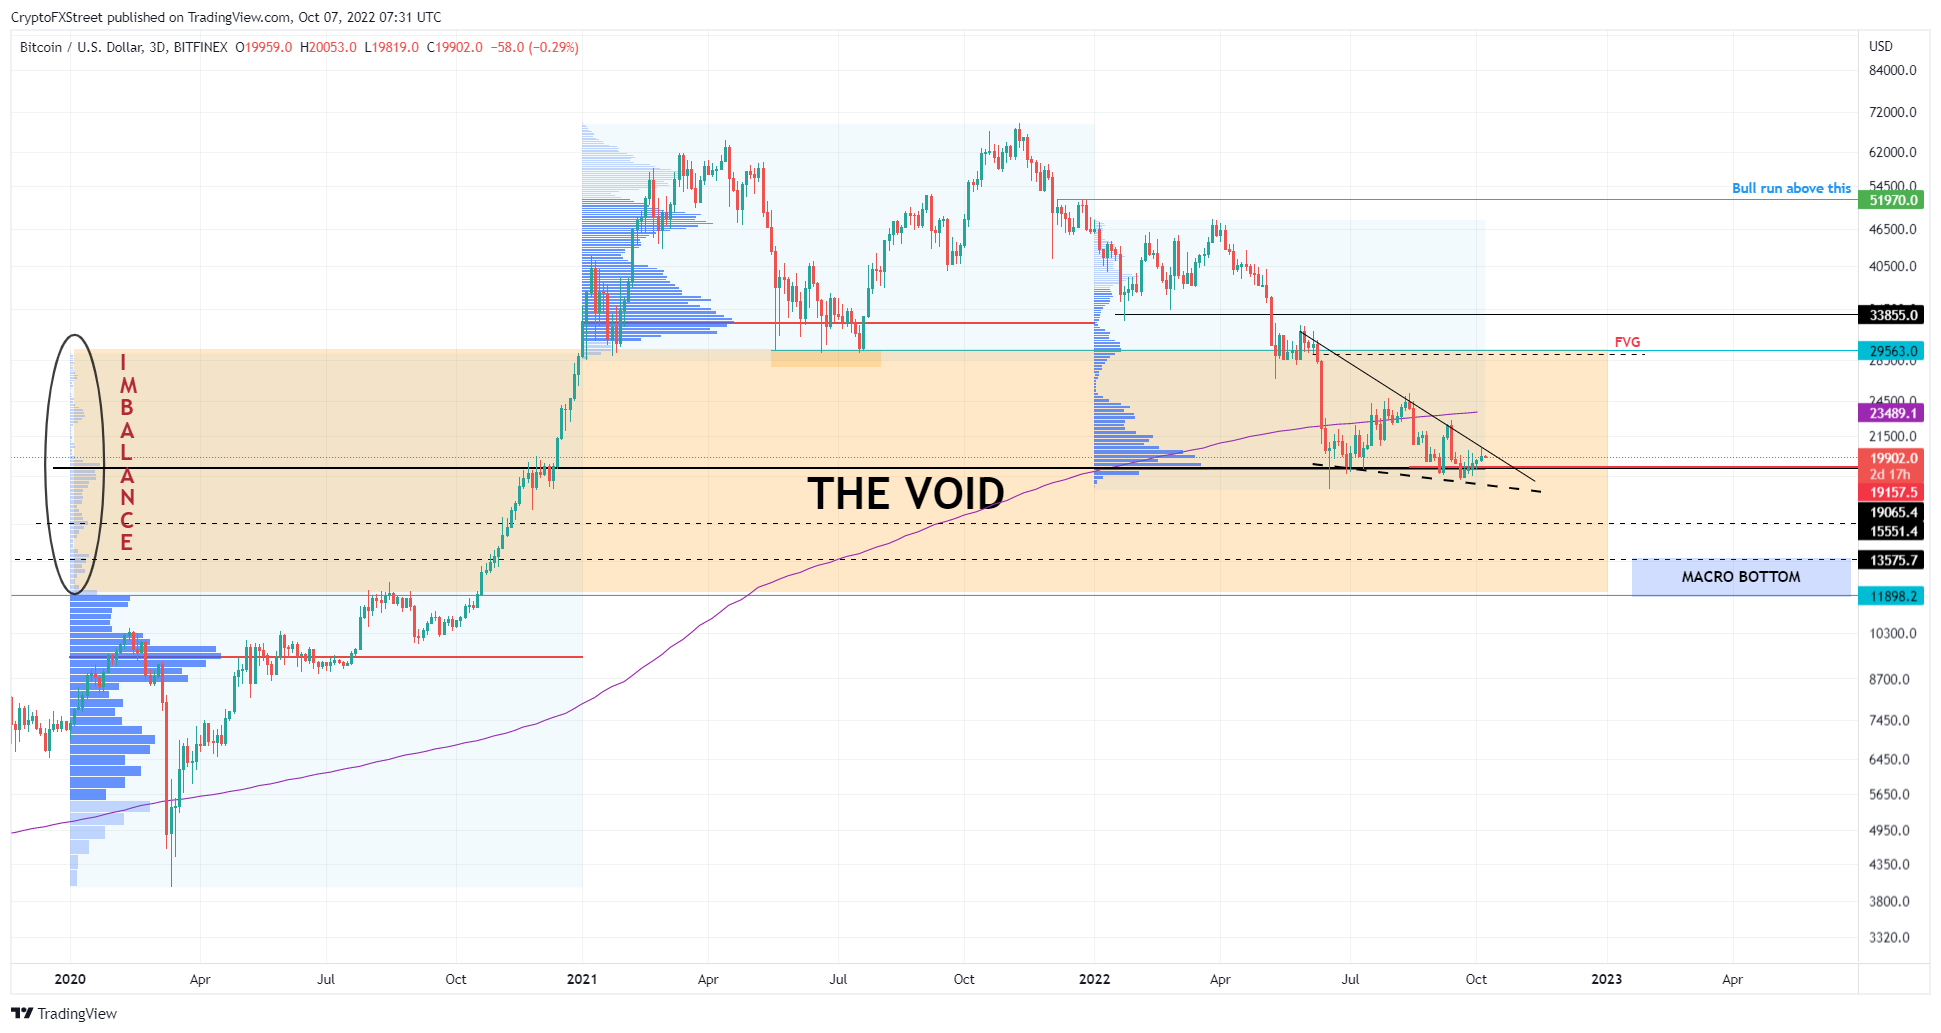
BTCUSDT 3-day chart
The next important chart is the eight-hour chart of Bitcoin price coupled with the Relative Strength Index (RSI), which has accurately predicted the local top/bottom formation since May 30.
After a brief consolidation between the $18,000 and $19,000 levels, Bitcoin price shot up to $20,400, and the RSI also broke above the 43 to 46 hurdle and flipped it into a support level. The rally that originated here formed a local top at $20,500, which coincided with RSI forming the seventh top at the 65 to 72 hurdle.
A closer look at the Bitcoin price shows a bear flag in play. As the name indicates, this technical formation contains a flagpole, which was formed as BTC crashed 18% between September 12 and 19. The consolidation in the form of an ascending parallel channel resulted in the flag formation.
A breakdown of this technical pattern forecasts an 18% downswing to $15,800, obtained by adding the flagpole’s height to the breakout point at $19,417.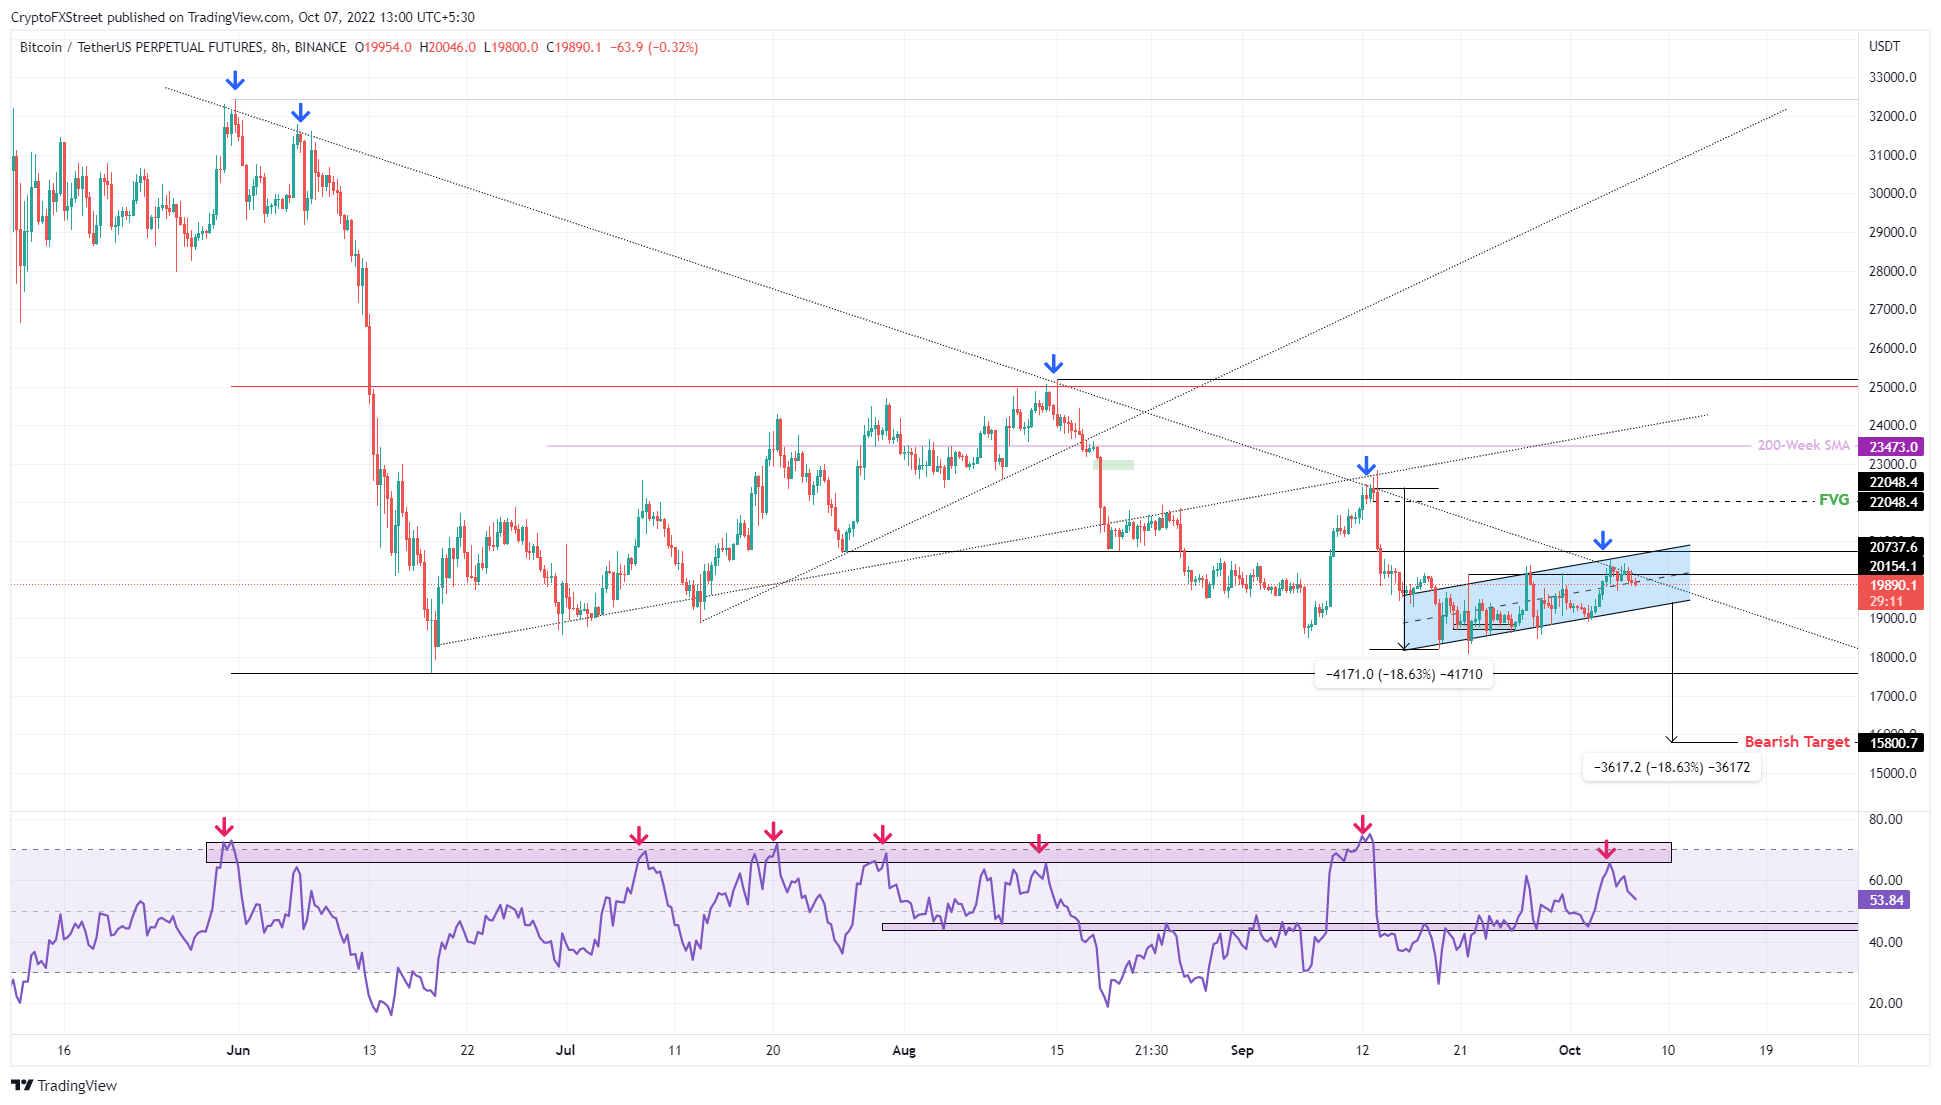
BTCUSDT 8-hour chart
Additionally, the realized price of whales holding more than 1,000 BTC is around $15,800. The realized price of these BTC is calculated by taking into account the volumes flowing in and out of exchanges and the Bitcoin price at that time.
Interestingly, this number coincides perfectly with the technical forecasts, adding more credence to the possibility of a steep correction to $15,800. 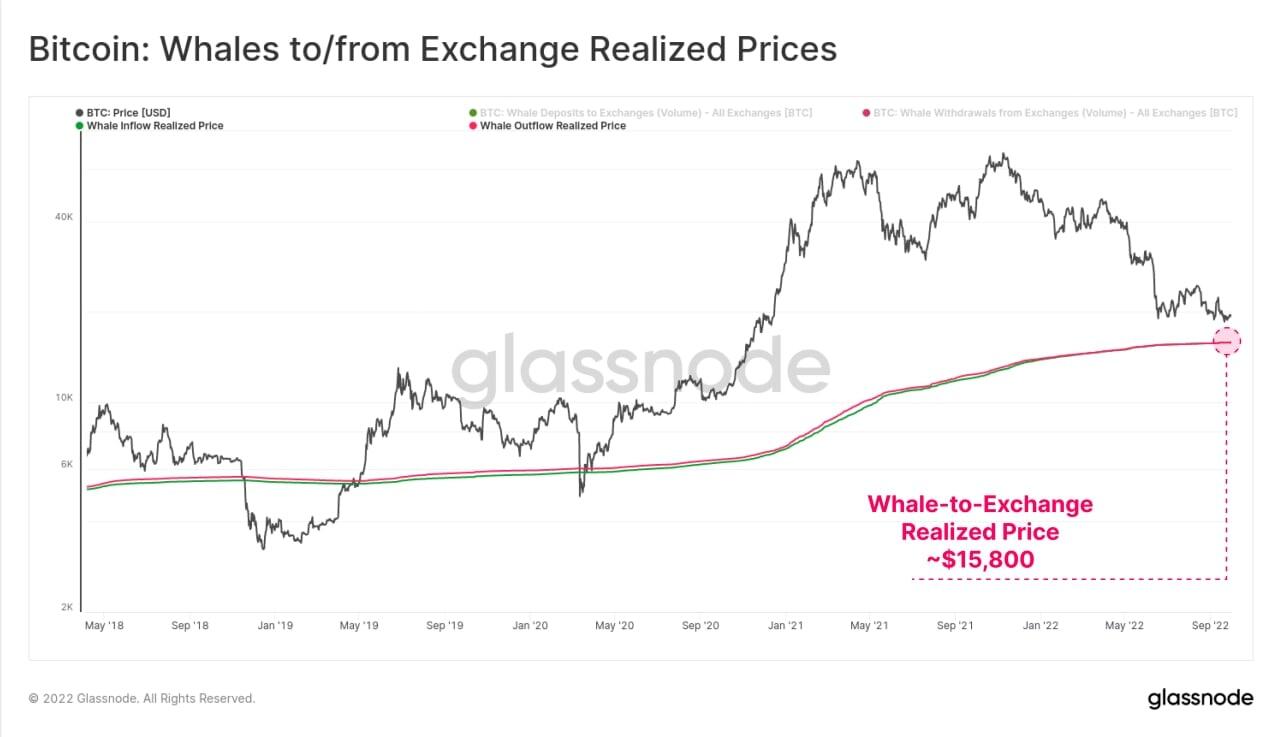
BTC Realized Price
While the initial outlook for Bitcoin price might seem bearish from the above explanation, investors should look at this potential crash to $15,800 as an opportunity to accumulate BTC and altcoins at a discount.
A surge in buying pressure at this level that results in a U-turn could be the best buying opportunity before Bitcoin price kick-starts a run-up to fill the CME gap, extending from $27,365 to $28,740.
These gaps are formed in Bitcoin price as the Chicago Mercantile Exchange (CME) halts trading at the weekend. Therefore, a rebalance of these inefficiencies could be another key driver that triggers a reversal at $15,800.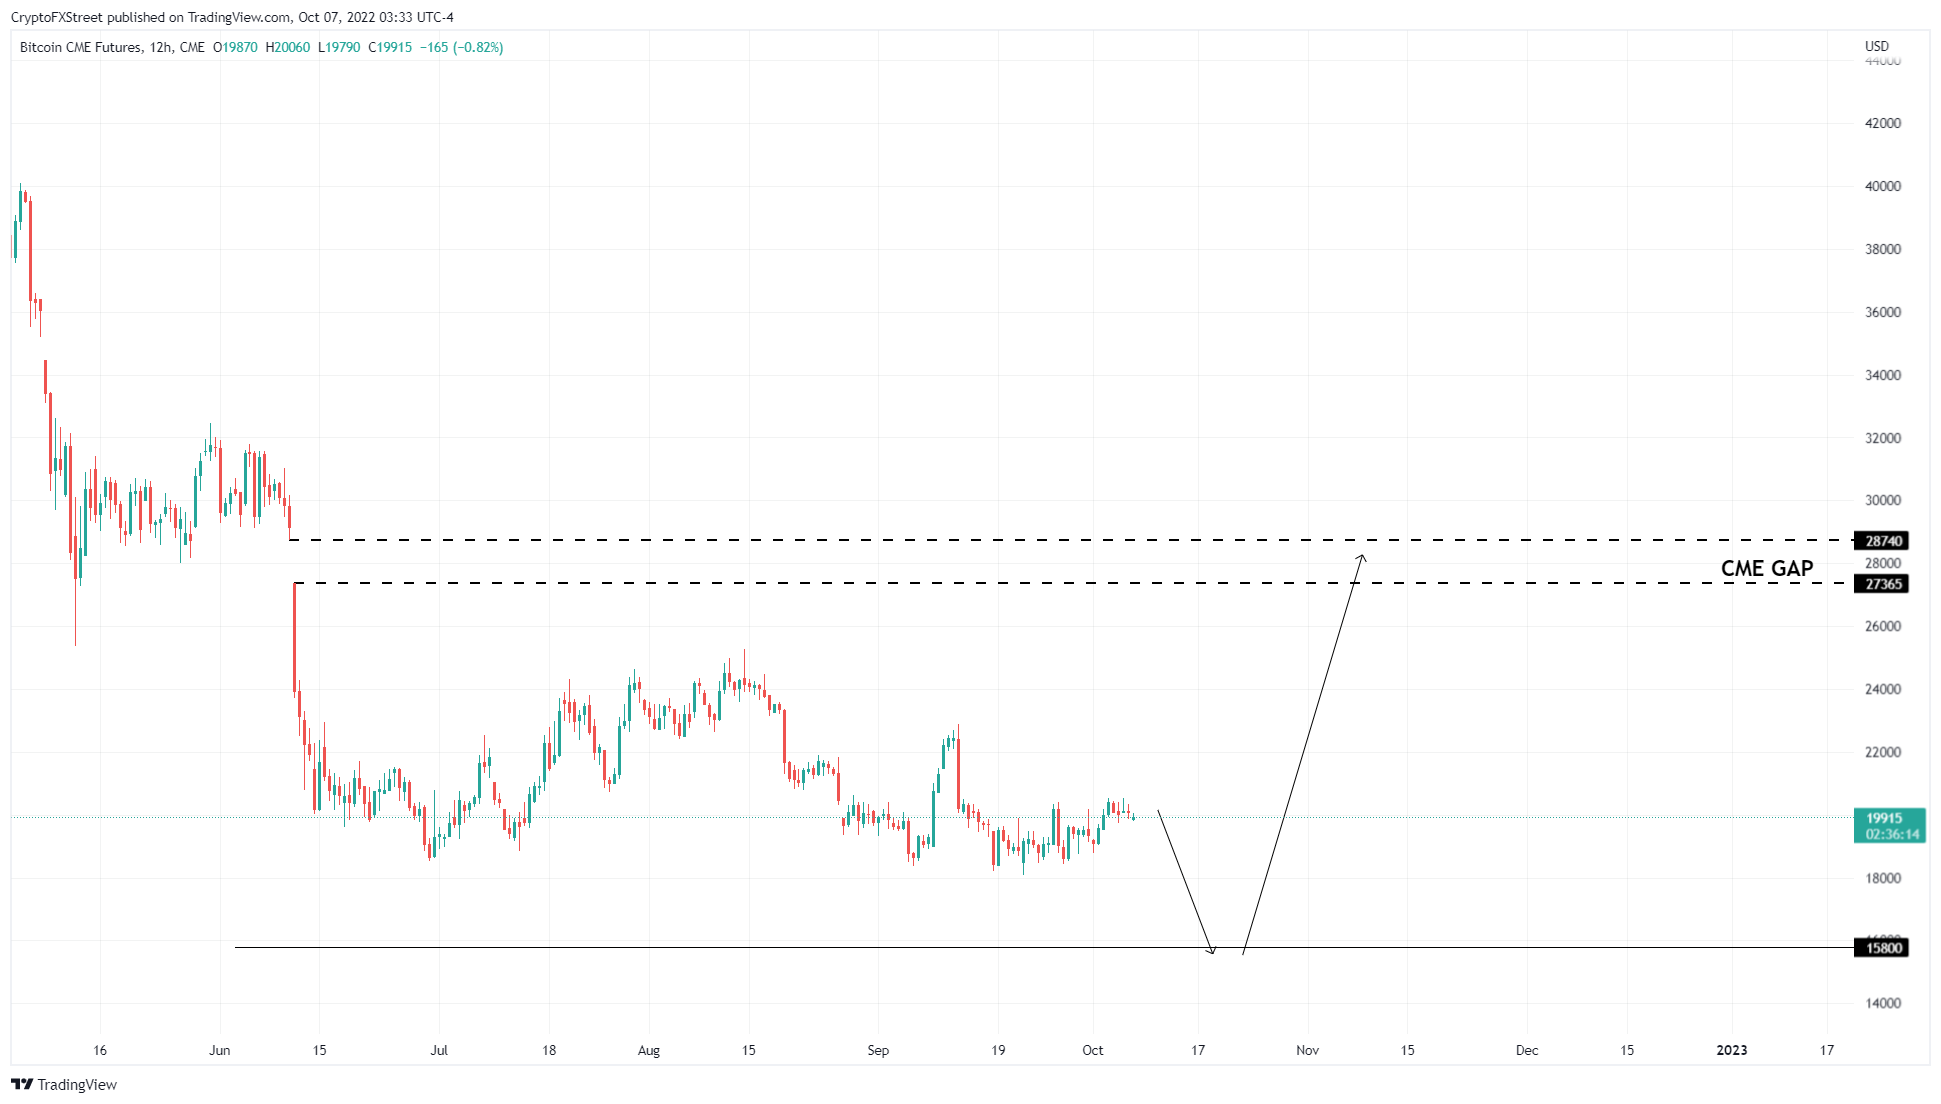
BTCUSD CME 12-hour chart
On the other hand, if the selling pressure continues to build up on the back of rising geopolitical tensions and worsening economic conditions, Bitcoin price could crash to $15,800 and fail to recover. If this downswing pushes BTC to flip the $15,551 support level into a resistance barrier, it will invalidate the bullish thesis detailed above.
In such a case, market participants should prepare for a potential crash to $13,575 and $11,989.
Information on these pages contains forward-looking statements that involve risks and uncertainties. Markets and instruments profiled on this page are for informational purposes only and should not in any way come across as a recommendation to buy or sell in these assets. You should do your own thorough research before making any investment decisions. FXStreet does not in any way guarantee that this information is free from mistakes, errors, or material misstatements. It also does not guarantee that this information is of a timely nature. Investing in Open Markets involves a great deal of risk, including the loss of all or a portion of your investment, as well as emotional distress. All risks, losses and costs associated with investing, including total loss of principal, are your responsibility. The views and opinions expressed in this article are those of the authors and do not necessarily reflect the official policy or position of FXStreet nor its advertisers. The author will not be held responsible for information that is found at the end of links posted on this page.
If not otherwise explicitly mentioned in the body of the article, at the time of writing, the author has no position in any stock mentioned in this article and no business relationship with any company mentioned. The author has not received compensation for writing this article, other than from FXStreet.
FXStreet and the author do not provide personalized recommendations. The author makes no representations as to the accuracy, completeness, or suitability of this information. FXStreet and the author will not be liable for any errors, omissions or any losses, injuries or damages arising from this information and its display or use. Errors and omissions excepted.
The author and FXStreet are not registered investment advisors and nothing in this article is intended to be investment advice.
Bitcoin price has been in a steady consolidation for more than two weeks and shows no signs of directional bias. However, the Non-Farm Payrolls (NFP) announcement on October 7 could trigger a volatile episode for BTC that could resolve its range tightening and establish a directional bias.
XRP price has set up a bullish reversal pattern that is already on its way to reaching its target. However, Bitcoin price is taking a hit due to its correlation with the traditional markets, causing altcoins, including Ripple, to slow down.
TRON price has been stuck trading inside a massive bearish pattern for more than a year. Although TRX came very close to triggering a bearish breakout, buyers stepped up and reversed the trend.
The world’s largest cryptocurrency exchange is observing an attack on its token chain and cryptocurrency. In response, Binance Coin’s price began falling on the charts making the investors highly concerned.
Bitcoin price has developed a bullish divergence with RSI, hinting at more upside. Despite the optimistic technicals, investors should expect volatile swings before the end of the third quarter of 2022.
Note: All information on this page is subject to change. The use of this website constitutes acceptance of our user agreement. Please read our privacy policy and legal disclaimer.
Trading foreign exchange on margin carries a high level of risk and may not be suitable for all investors. The high degree of leverage can work against you as well as for you. Before deciding to trade foreign exchange you should carefully consider your investment objectives, level of experience and risk appetite. The possibility exists that you could sustain a loss of some or all of your initial investment and therefore you should not invest money that you cannot afford to lose. You should be aware of all the risks associated with foreign exchange trading and seek advice from an independent financial advisor if you have any doubts.
Opinions expressed at FXStreet are those of the individual authors and do not necessarily represent the opinion of FXStreet or its management. FXStreet has not verified the accuracy or basis-in-fact of any claim or statement made by any independent author: errors and omissions may occur. Any opinions, news, research, analyses, prices or other information contained on this website, by FXStreet, its employees, clients or contributors, is provided as general market commentary and does not constitute investment advice. FXStreet will not accept liability for any loss or damage, including without limitation to, any loss of profit, which may arise directly or indirectly from use of or reliance on such information.