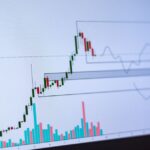

XRP’s current price action is echoing the technical patterns observed during its significant rally in early 2025, suggesting a potential upswing towards the $3.75–$4.00 price range. This analysis relies on identifying and comparing key technical indicators and chart formations from both periods. A detailed comparison reveals striking similarities, lending credence to the predictive power of these patterns.
The early 2025 rally was characterized by several distinct phases. Initially, a period of consolidation formed a base, followed by a gradual increase in trading volume and a breakout above a significant resistance level. This breakout was then confirmed by a series of higher highs and higher lows, indicative of a strong upward trend. We are currently witnessing a similar pattern unfold. A recent period of consolidation has been observed, with price action contained within a defined range. This consolidation phase is crucial as it represents the accumulation phase before a potential breakout.
The key technical indicators that support this parallel include relative strength index (RSI), moving average convergence divergence (MACD), and various support and resistance levels. In both the early 2025 rally and the current price action, these indicators exhibited similar patterns prior to the significant price increase. For example, the RSI showed signs of oversold conditions before the start of the previous rally, which is being echoed in current readings. Similarly, the MACD is showing signs of a bullish crossover, a pattern that reliably preceded the earlier price surge. The current support levels mirror the support levels that held during the previous rally, indicating a potential area of buying pressure.
However, it’s crucial to acknowledge the inherent limitations of technical analysis. While past performance doesn’t guarantee future results, the resemblance between the current price action and the technical indicators from early 2025 provides a compelling case for a potential rally towards the $3.75–$4.00 range. This potential upswing is not a guaranteed outcome, and various factors, including broader market sentiment and regulatory developments, could influence the actual price movement. Investors should exercise caution and conduct thorough due diligence before making any investment decisions. This analysis is solely for informational purposes and doesn’t constitute financial advice.