
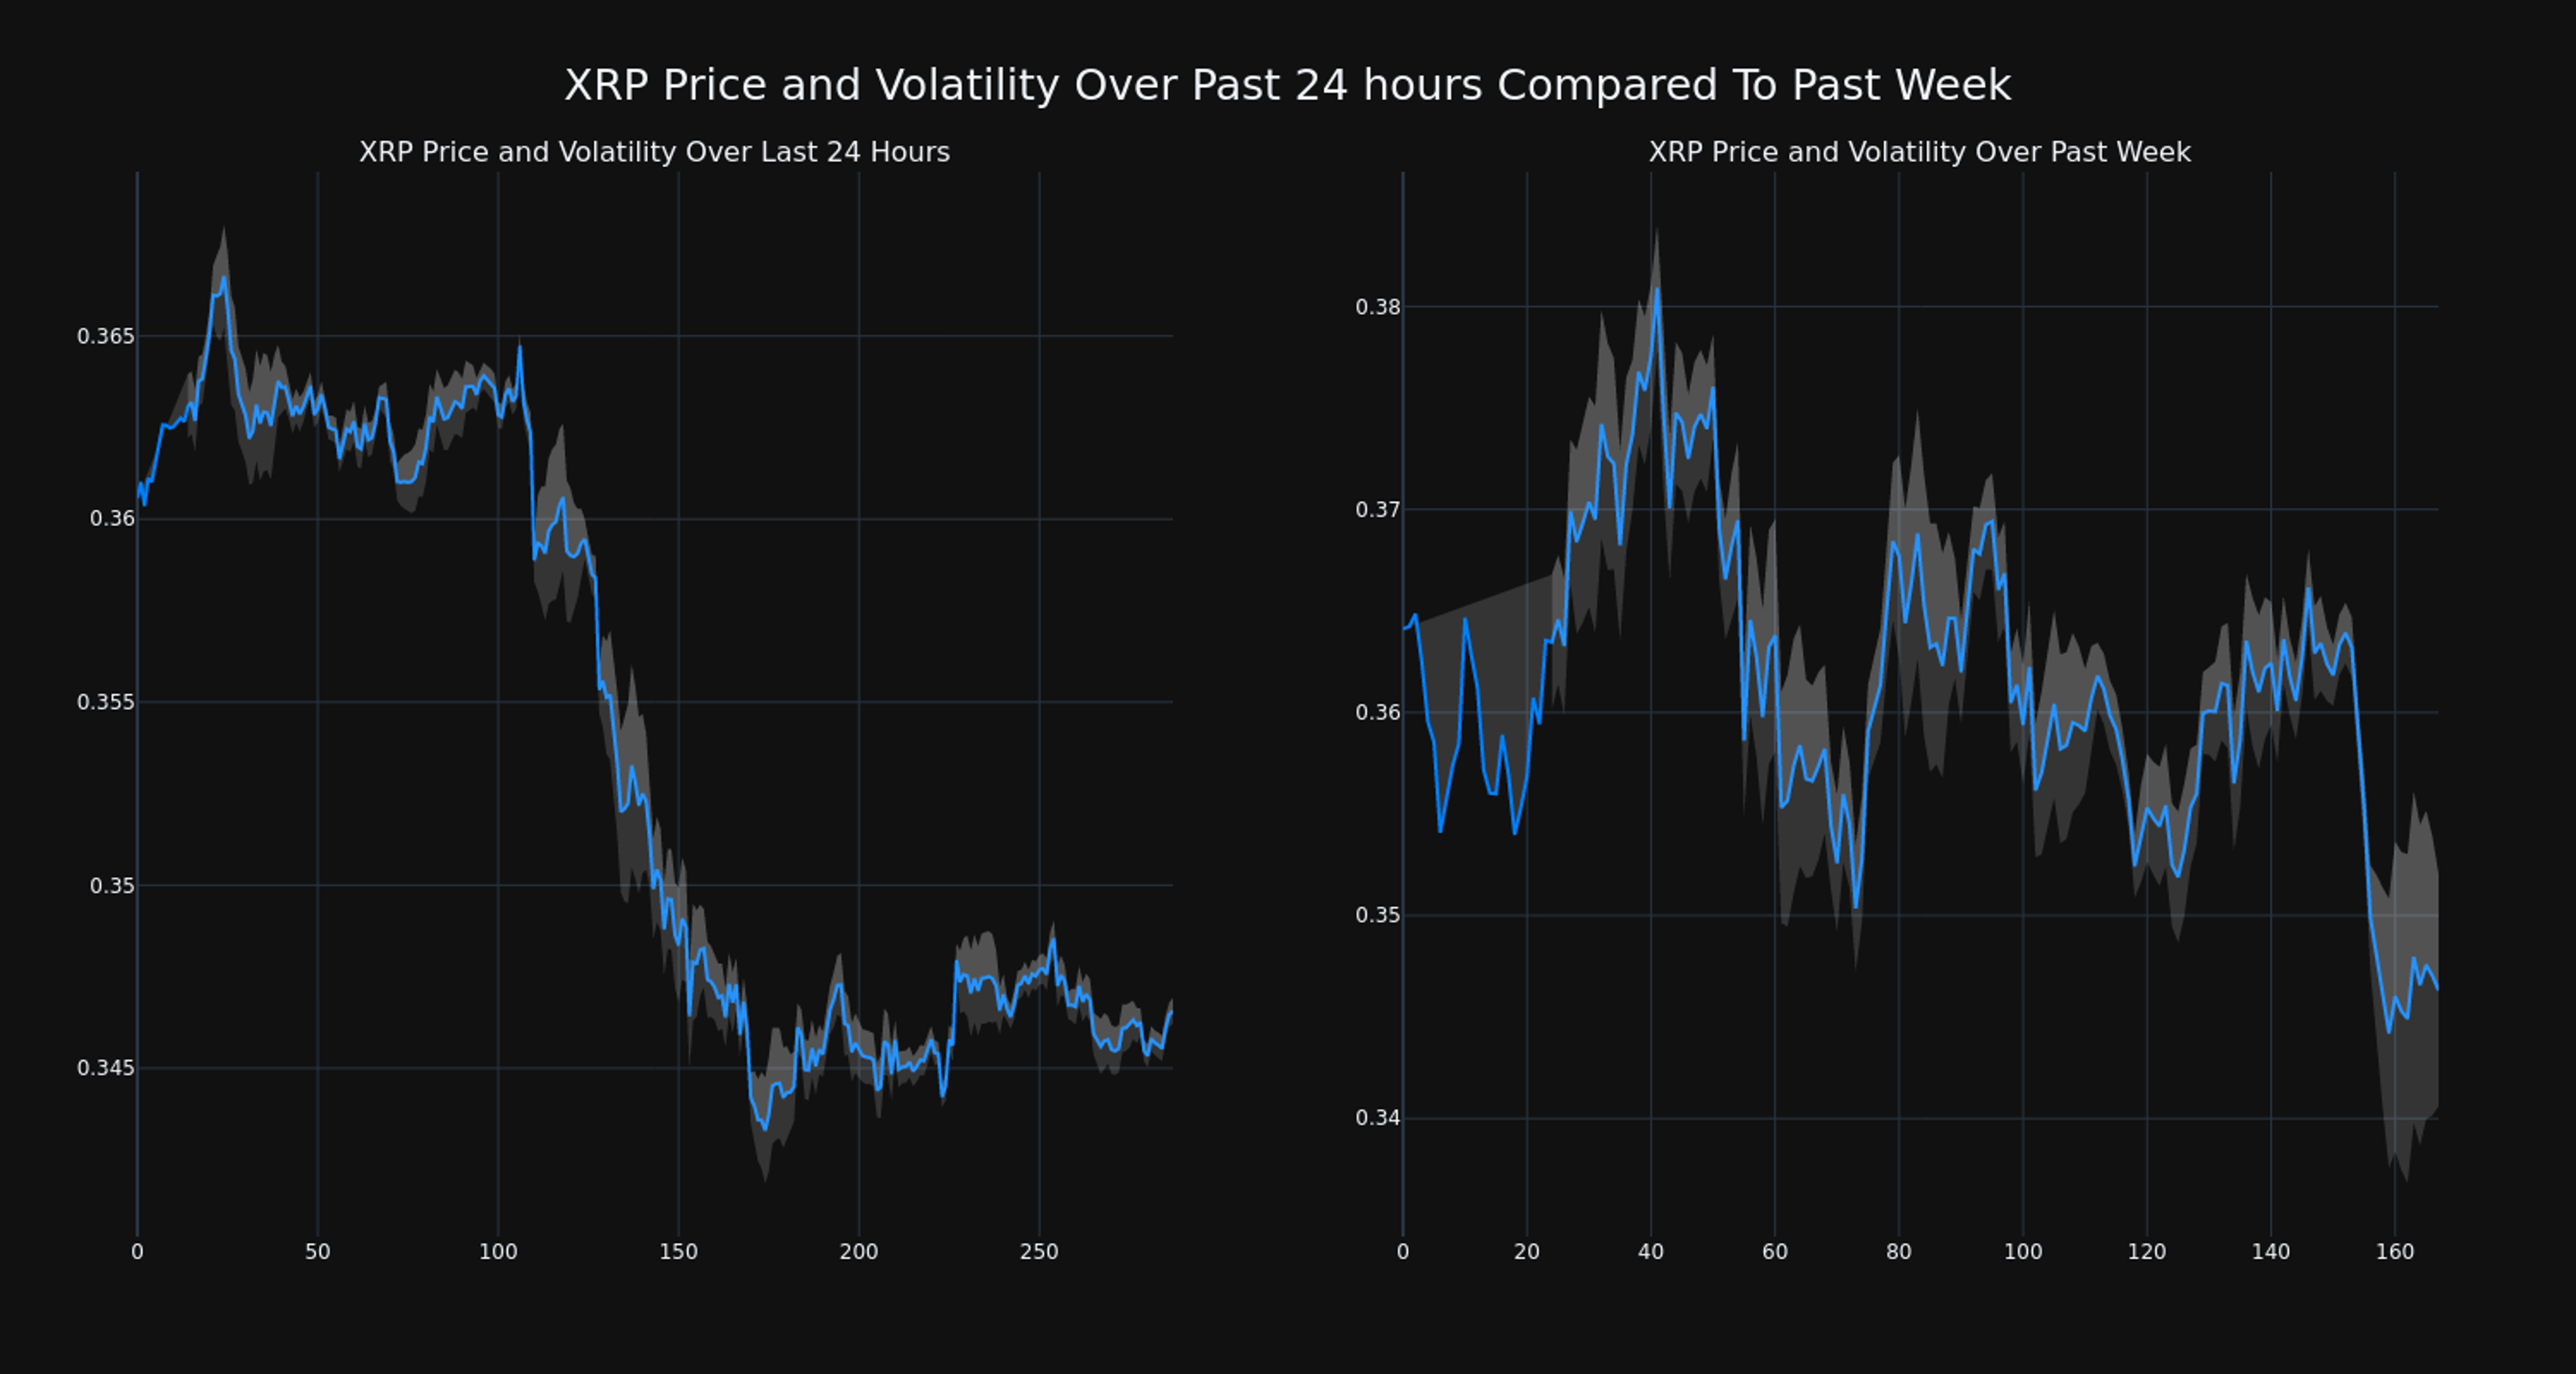
Over the past 24 hours, XRP's XRP/USD price has fallen 4.05% to $0.35. This continues its negative trend over the past week where it has experienced a 5.0% loss, moving from $0.36 to its current price.
The chart below compares the price movement and volatility for XRP over the past 24 hours (left) to its price movement over the past week (right). The gray bands are Bollinger Bands, measuring the volatility for both the daily and weekly price movements. The wider the bands are, or the larger the gray area is at any given moment, the larger the volatility.
The trading volume for the coin has tumbled 36.0% over the past week along with the circulating supply of the coin, which has fallen 0.41%. This brings the circulating supply to 48.34 billion, which makes up an estimated 48.34% of its max supply of 100.00 billion. According to our data, the current market cap ranking for XRP is #7 at $16.73 billion.

This article was generated by Benzinga's automated content engine and reviewed by an editor.
Visit Benzinga’s Crypto Homepage – 1,000,000+ depend on Benzinga Crypto every month
© 2022 Benzinga.com. Benzinga does not provide investment advice. All rights reserved.